Page 30 - CGC_Annual_Report_2014
P. 30
Annual Report 2013-2014
Financial Report for the Year Ended 31 August 2014
NOTES TO THE FINANCIAL STATEMENTS
FOR THE YEAR ENDED 31 AUGUST 2014
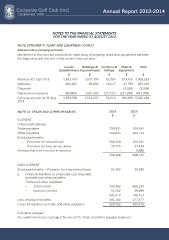
NOTE 9 PROPERTY, PLANT AND EQUIPMENT (CONT.)
Movements in carrying amounts.
Movement in the carrying amounts for each class of property, plant and equipment between
the beginning and the end of the current financial year.
Course Buildings & Furniture & Plant & Total
Establishment Improvements Fittings Equipment
$ $ $ $$
Balance at 1 Sep 2013 2,593,105 1,577,499 62,004 573,445 4,806,053
Additions
Disposals 803,202 66,058 18,217 47,759 935,236
Depreciation expense
Carrying amount at 31 Aug (3,339) (3,339)
2014
(86,569) (130,120) (27,711) (227,366) (471,766)
3,309,738 1,513,437 52,510 390,499 5,266,184
NOTE 10: TRADE AND OTHER PAYABLES 2014 2013
$ $
CURRENT
Unsecured liabilities: 290,932 159,764
Trade payables 259,833 264,724
Other payables
Employee benefits 204,228 200,242
35,375 37,436
- Provision for annual leave - 5,988
- Provision for long service leave
Membership fees received in advance 790,368 668,154
NON CURRENT 51,502 39,999
Employee benefits – Provision for long service leave
a. Financial liabilities at amortised cost classified 790,368 668,154
51,502 39,999
as trade and other payables
Trade and other payables: 841,870 708,153
– total current 291,105 277,677
– total non-current 550,765 430,476
Less employee benefits
Financial liabilities as trade and other payables
Collateral pledged
No collateral has been pledged for any of the trade and other payable balances.
6_0700 Page 13 of 22
Financial Report for the Year Ended 31 August 2014
NOTES TO THE FINANCIAL STATEMENTS
FOR THE YEAR ENDED 31 AUGUST 2014
NOTE 9 PROPERTY, PLANT AND EQUIPMENT (CONT.)
Movements in carrying amounts.
Movement in the carrying amounts for each class of property, plant and equipment between
the beginning and the end of the current financial year.
Course Buildings & Furniture & Plant & Total
Establishment Improvements Fittings Equipment
$ $ $ $$
Balance at 1 Sep 2013 2,593,105 1,577,499 62,004 573,445 4,806,053
Additions
Disposals 803,202 66,058 18,217 47,759 935,236
Depreciation expense
Carrying amount at 31 Aug (3,339) (3,339)
2014
(86,569) (130,120) (27,711) (227,366) (471,766)
3,309,738 1,513,437 52,510 390,499 5,266,184
NOTE 10: TRADE AND OTHER PAYABLES 2014 2013
$ $
CURRENT
Unsecured liabilities: 290,932 159,764
Trade payables 259,833 264,724
Other payables
Employee benefits 204,228 200,242
35,375 37,436
- Provision for annual leave - 5,988
- Provision for long service leave
Membership fees received in advance 790,368 668,154
NON CURRENT 51,502 39,999
Employee benefits – Provision for long service leave
a. Financial liabilities at amortised cost classified 790,368 668,154
51,502 39,999
as trade and other payables
Trade and other payables: 841,870 708,153
– total current 291,105 277,677
– total non-current 550,765 430,476
Less employee benefits
Financial liabilities as trade and other payables
Collateral pledged
No collateral has been pledged for any of the trade and other payable balances.
6_0700 Page 13 of 22